
Easy fuel economy comparisons
Visual Fuel Economy Guide
Powerful information for consumer decision making
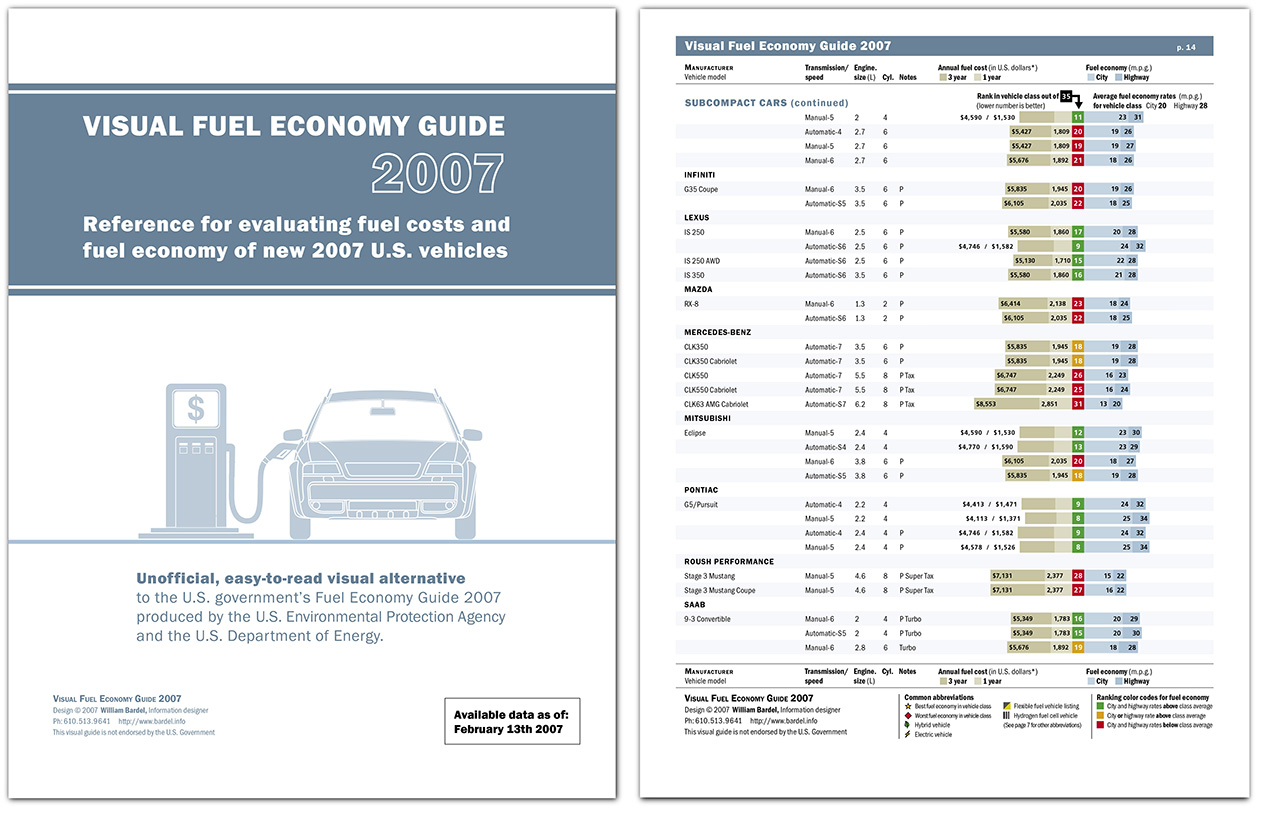
Each year the U.S. EPA and U.S. DOE publishes a Fuel Economy Guide full of numerical data tables to provide the U.S. public with information on new vehicles and their fuel consumption costs. This important reference helps U.S. consumers calculate the operating cost of new vehicle purchases. While compact in size, the numerical table format in the U.S. government’s guide does not facilitate quick, broad comparisons within the large amounts of data. It is difficult to use and takes considerable time to read.
Empowering U.S. car consumers with better information tools
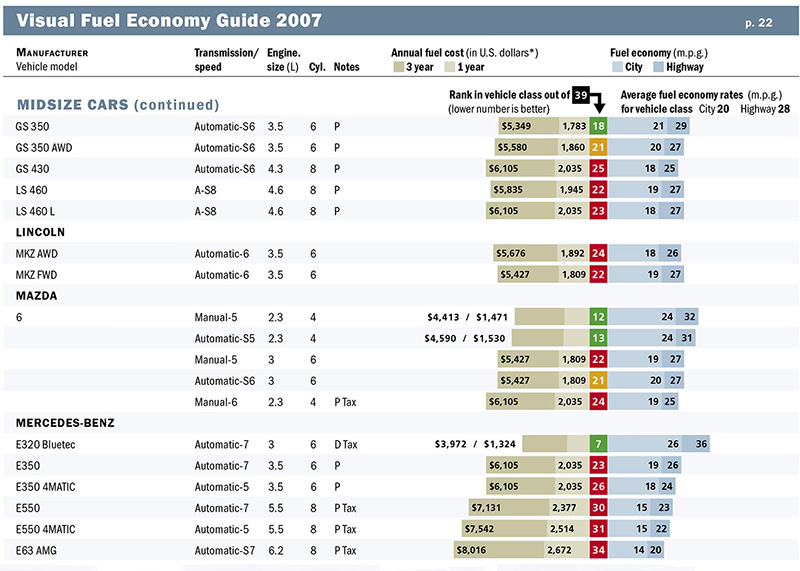
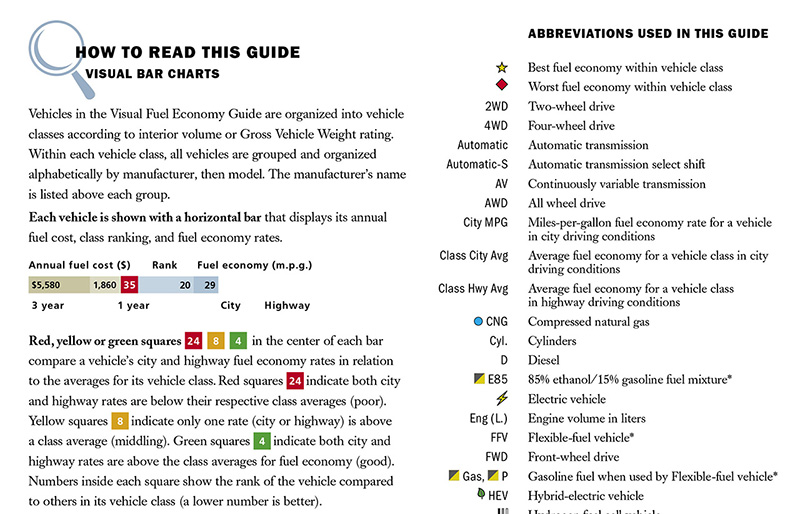
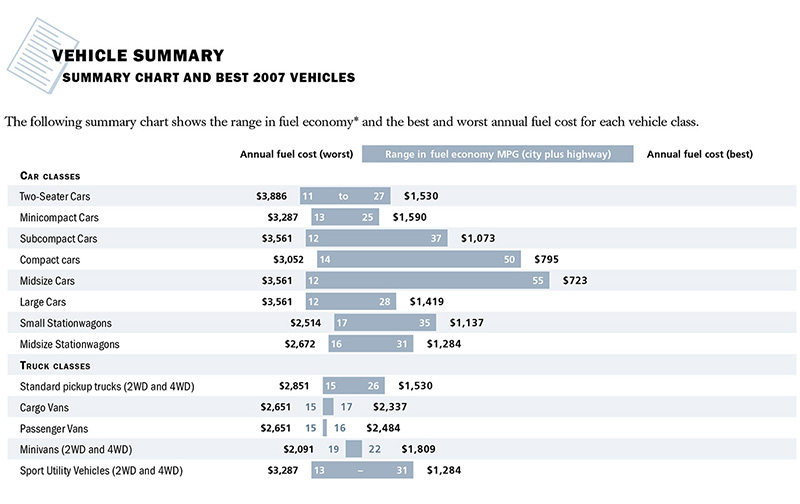
Luminant Design designed the “Visual Fuel Economy Guide” to provide U.S. car buyers an easy-to-read visual alternative to the government's table-driven report. The Visual Fuel Economy Guide uses bar charts to improve access by visual comparison. Why? Our eyes are faster at seeing quantitative differences in bar lengths than our mind is at reading, holding, and calculating the differences between a large bunch of numbers. Several ranking features included also help the reader determine whether vehicles are below, equal to, or above the average fuel economy for their respective vehicle class.
Client: American public
Date: Published 2007, 2008